How to Scan a Codebase for Reliability Risks with rvl-cli
Install the Revelara CLI, point it at a codebase, and read your first ranked reliability risk register. About fifteen minutes end to end, walked on a real public repo you can clone and check.
Clone a repo you’ve never scanned, install the Revelara CLI, run one scan, and read a ranked list of the reliability risks in that codebase. Budget about fifteen minutes end to end, and know that your hands-on part is a fraction of it. The scan does analysis, reading your code against a controls catalog with expert lenses, and real analysis takes longer than a grep. Kick it off, click through the permissions prompts, and load the risk register. This post is a walkthrough, using a public repo you can clone yourself.
A quick word on why this is worth fifteen minutes of your week. If you’re shipping with an AI coding agent, your throughput went up this year but your reliability review process almost certainly didn’t. Nobody added a step where someone asks “what happens when this service’s downstream dependency gets slow.” Revelara is that step, and it runs before a PR exists.
What you need
Three things:
- a terminal,
- a git repo to scan,
- and a Revelara account (there’s a free trial, no card).
For the repo, I’m using the Google microservices demo, a public Kubernetes sample app with eleven services across Go, Python, Node, C#, and Java. It’s a good test because it was built to demonstrate architecture, not to survive production, so it has the kinds of gaps real codebases have.
The CLI is a standalone Go binary. It runs on your machine, and your code stays on your machine. What travels to Revelara is findings metadata, not your source. That’ll be its own post, but it’s worth saying now because it’s a common question.
Step one: create your account and set up the CLI
- Create your account at Revelara.ai
- Create an API key (follow the onboarding welcome guide for instructions)
- Install the CLI (macOS/Linux):
brew tap revelara-ai/tap
brew trust revelara-ai/tap
brew install --cask rvl
rvl config set api_key <your-key>
- Install your editor agent plugin
rvl init
rvl plugin install claude
(Other editors are supported, run rvl plugin editors to see all available options)
- Verify you’re connected
rvl status
Step two: point it at a repo
git clone https://github.com/GoogleCloudPlatform/microservices-demo
cd microservices-demo
rvl init
rvl init writes a .revelara.yaml file at the repo root. The config file also has a criticality field worth setting. A hobby project and a customer-facing service get different risk math, and the scanner trusts your answer.
Step three: the scan
Open your agent. In my case, that’s Claude Code. Once there, run:
/rvl:scan
This part takes a little time. On the demo repo the scan runs about 10 minutes. Depending on your permissions settings, you might have to approve scan actions. I recommend watching the actions it takes once or twice before allowing more liberal access, but here’s what happens:
The scanner walks the repo and matches what it finds against a catalog of 70 active controls. You can think of controls as compliance rules. Revelara’s reliability controls cover fault tolerance, monitoring, disaster recovery, incident response, SLO coverage, and more. Backing every control is grounding in real public incident data from a corpus of thousands of documented incidents, which is where this stops being a linter and starts being something else.
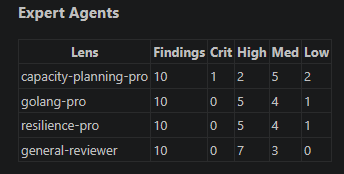
The scanner asks me which lenses I’d like to apply. I can approve the three it picked, or I can define my own set. In this case, I went with the defaults: golang, resilience, and capacity planning, plus a general reviewer that runs regardless. Each lens runs as its own expert agent, and it scans the codebase for reliability issues, finding the bad and the good.

I love this part: it flagged two things done right, the frontend’s 100ms timeout on getAd and its nil-fallback handling, and suggested them as reference implementations for the other RPC wrappers. A reviewer who only ever tells you what’s broken is a scold. One that identifies the patterns worth copying is doing something closer to mentorship.
The swarm of agents then reconciles the found issues, and corroborates them against known incident data. It submits the results to the risk register, and returns an ordered list of the findings by the level of risk each poses to the business.
On this repo, the scan comes back with 40 findings, split across the four agents: 1 critical, 19 high, 16 medium, 4 low.
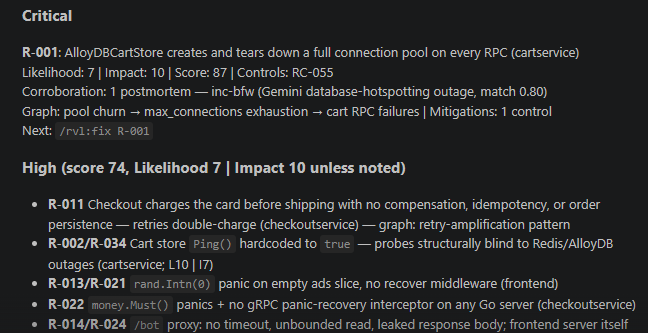
The critical finding sits at the top with its causal chain spelled out: pool churn leading to max_connections exhaustion leading to cart RPC failures. Below it, the high band reads like a checklist of quiet production hazards: a checkout path that charges the card before shipping with no idempotency (a double-charge waiting for a retry storm), health probes hardcoded to return true (structurally blind to the very outages they exist to catch), panic paths with no recovery interceptor, and a proxy with no timeout and an unbounded read. None of these would fail a unit test, but all of them have the potential to create a bad day.
Read one finding properly
Here’s the one I’d open first: R-001, the critical. Its register line, in the screenshot above, packs in everything you need for a first read.
Start with the mechanism. The cart service creates a brand-new database connection pool on every RPC call and disposes of it at method end. NpgsqlDataSource owns its own pool, so every cart operation spawns fresh TCP/TLS handshakes and Postgres backend processes, and under load that’s a straight line to the max_connections exhaustion the causal chain warned about. Click into the finding and the detail view lays out the score math in the open, likelihood times impact adjusted by the criticality you set back in .revelara.yaml, so “critical” is an argument you can inspect, not a color someone chose.
And then the part that makes this more than a lint rule: corroboration. The register line shows this finding matched against a documented database-hotspotting outage in the incident corpus, one corroborating postmortem, match confidence shown. The claim comes with receipts: this failure shape has happened, here’s the writeup, go read it and decide whether it matches your situation. Your judgment stays in the loop. The scanner just did the retrieval that used to require a decade of accumulated scar tissue.
The line even tells you the next move: /rvl:fix R-001.
That’s also what makes the finding defensible in code review. “Fixing the pool churn per R-001, see the corroborating incident” is an argument your reviewer can check.
What the register gives you that a scroll of findings doesn’t
rvl risk list shows the register: every finding is ranked and scored, mapped to a control, and filterable by service and severity. The ranking is the difference between a sentiment (“we should improve reliability”) and a sprint plan (“these three items are the highest-scored risks in the checkout path”). When someone asks where the codebase stands on reliability, the register has an answer, because every line in it traces to a control and an incident.
Where to go from here
The first-scan version ends at the register, and two commands pick up where it leaves off: /rvl:ask for a deeper analysis of a risk and why it matters, and /rvl:fix <risk_code> to fix the issue. Past the commands, the entire corpus is at your fingertips. From the UI you can run thematic analysis across the whole incident set, the kind of reading that would eat a week by hand, or plug the corpus into your agent over MCP and keep that context where you code. Each of those gets its own walkthrough soon.
Run it on something real. The demo repo proves the mechanics, but the register gets more interesting when it’s looking at your services. Start here.